The annual battle of the plots between companies will soon be into high gear. This year we are seeing variability across fields that leaves experienced farmers shaking their head. Yield monitors are telling the less experienced the same thing. Yields from one end of the field to the other can vary from 80 to 200 bu. This is an unprecedented spread, at least in this part of Ontario.
The biggest contributor to this is the lack of available moisture deep in the soil profile. One wise person made the comment that yield maps this year will be revealing more about the variability of our sub-soils than anything else.
Against this backdrop, seed company reps including yours truly will be flogging a variety of plot results. How much validity is in the data presented? An experience I had recently illustrates how misleading one plot can be.
I was with a customer who split his 12 row planter between Pioneer P0474HR and Dekalb DKC 50-45.
The first side-by-side produced the following result.
P0474HR - 191 bu @ 21.7
DKC 50-45 - 172 bu @ 21.5
These numbers would leave the folks wearing Pioneer underwear breathless with ecstasy. Those with Dekalb underwear would claim foul because it was weighed by a Pioneer guy and totally disregard the whole experience.
We moved over 8 rows and replicated the weigh off.
P0474HR - 182 bu @ 21.9
DKC 50-45 - 182 bu @ 21.6
Significantly different numbers 20 ft apart in a field that appears to be perfectly uniform. We stopped there because it was time to go get something to eat.
The Pioneer underwear types would say we won by an average of 9 bu. Happy days are here again. The Dekalb underwear types would say the only reason Pioneer looked a little better was because P0474HR is a later hybrid. You can see that by the difference in moisture. I would tell both types to take a seat in the "time out" chair.
Does either result have any significance? Not really. Statistic analysis of side by side data tells the truth. A 12 bu/acre difference has only a 60% chance of predicting the best hybrid for next year if we rely on only one plot. If we had 10 plots, a 12 bu advantage increases the probability to 90%. The problem today is with so many hybrids to choose from, getting a large number of comparisons in a local area is very difficult.
As far as individual plots in our neighbourhood having a lot of significance this year, I tend to think not.
My take home message is stay wary of the "painted underwear" types.
Wednesday, October 17, 2012


Monday, October 8, 2012
A Photo Finish
Our soybean planting date trial was harvested last week and the results are listed below.


92Y12 - May 11 55.8 bu/acre @ 13.5%
92Y12 - May 26 53.8 bu/acre @ 13.5%
91Y61 - May 11 56.0 bu/acre @ 13.0%
91Y61 - May 26 54.0 bu/acre @ 13.0%
Interesting how the yield difference was consistent with both varieties at 2 bushels apart. In a sense I am not surprised that the results were close. Looking back at my notes, the May 26 planting date was a full stage behind the May 11 date. (For a refresher, look at my "Down the Back Straight" post on August 10). Rainfall pattern favoured the later planting date. We went through late June and July on barely 1" of rain. August was kinder with 2.5 ". There were 12 days of over 30 degree highs in July and only 3 days in August which tended to favour yield development of the later planting date. The growing season was also long enough to allow full season varieties to reach maturity with time to spare.
Nonetheless, there was a definite response with the May 11 planting date which fits the longer term trend.
OMAFRA research into planting date response over 3 years shows a 4 bu/acre response for the same time period, May 10 to May 24.
Pioneer has initiated a number of planting date trials this year. I have been hearing of higher responses to earlier planting and will report the summary later.
On a different topic we also evaluated response to applications of Acapela fungicide on soybeans applied at the R1 stage. We had 5 locations of treated vs untreated and one location also had a strip of Headline as a comparison. The yield environments ranged from 50 to 64 bushels, so our selection of sites were generally higher yielding locations in the area.
Four of the five had positive response and one location had no response. The 4 positive responses accumulated a total of 8.4 bushels of extra beans for an average reponse over the 5 trials of 1.7 bu. The Acapela vs Headline resulted in the same 1.5 bushel response to both fungicides over untreated.
OMAFRA has studies which predict a 2 bu or 4% response to fungicide use which closely agrees with our results.
Not exactly the stuff to excite a fungicide sales person, but if you have your own sprayer there is a positive economic return. I tend to believe yield claims for fungicides, while usually overated, are still reflected in responses like ours.
Early planting dates and fungicides are tools in the toolbox useful for achieving maximum economic returns in soybeans.
Monday, October 1, 2012
Better Call Agricorp

Tony Koot contacted me earlier today. His 90Y90 soybeans yielded 69.2 bu per acre. One of the quickest ways to get Agricorp's attention is to produce a crop way above your guarantee.
Nice job, Tony.
Friday, September 28, 2012
IMPACT Lessons
Yesterday the Pioneer IMPACT team showed up to combine their soybean plot behind our warehouse.

Another example of this occurred last week. Brian and I were with a large group of Pioneer agronomists, plant breeders and assorted technical specialists from Ontario, Michigan and Ohio looking at our corn IMPACT plot at Bill McIlhargey's. This group is responsible for developing and evaluating corn genetics for the Great Lakes area. They were on an evaluation tour of dozens of corn IMPACT sites across the province. IMPACT plots typically have about 28 corn hybrids. Half of these are new hybrids. The rest is split between current Pioneer hybrids and competitive hybrids that a lot of you currently grow. Each plot is 8 rows wide by 56 feet long and there are replicated check hybrids at each location. The check hybrids are proven Pioneer hybrids currently sold. The IMPACT plot is the last step in the selection process new hybrids are subjected to. The new hybrid, or soybean variety, must do well in IMPACT testing before they make the team.
IMPACT plot locations are carefully chosen and placed on a wide range of soil types from sand to loam to heavy clay. The intent is to expose hybrids to typical field conditions that occur across Ontario. The main criteria of each site is uniformity of soil type, drainage and slope. Those of you that know the front of Bill's farm understand why this location meets the standard. It would be considered a high yield site with well drained silt loam soil.
The only problem is when you receive one inch of rain from July through August a site with high yield potential can become somewhat less than high yield. And pose a challenging question to the evaluation team.

 These two pictures are of a Pioneer hybrid currently on the market. (Please don't panic and start calling because Brian and I do not sell a lot of this hybrid.) My point is not to prove that we are incredibly smart in not promoting it. This hybrid is used as a check hybrid and has some important characteristics for growers.
 This picture is the same hybrid about 100 feet east from where I took the first two pictures. Looks fantastic. Now, put yourself in the agronomist position. What have you learned? Is this hybrid a total piece of trash? Customers like the hybrid and continue to purchase it. But the first two pictures would sure make you stop and think. Nobody wants to expose customers to that kind of response to drought. Or has the extreme lack of rainfall caused a 1 out of a 100 type response. We are dealing with genetics and there is no sure thing. And what about the new hybrids and the responses we witness at this location? Are we seeing the worst or the best of the new hybrid?
The correct answer is, while the mental pictures will stay in our head, the yield data generated from this one location is probably useless. There is too much variability to generate meaningful comparisons.
This makes us ponder the strip plot comparisons we have planted in our own fields. Will this information be useful? Or do we have the same problem as this IMPACT site?

There is a huge effort put into the IMPACT program evaluating the next generation of soybean and corn genetics. Another example of this occurred last week. Brian and I were with a large group of Pioneer agronomists, plant breeders and assorted technical specialists from Ontario, Michigan and Ohio looking at our corn IMPACT plot at Bill McIlhargey's. This group is responsible for developing and evaluating corn genetics for the Great Lakes area. They were on an evaluation tour of dozens of corn IMPACT sites across the province. IMPACT plots typically have about 28 corn hybrids. Half of these are new hybrids. The rest is split between current Pioneer hybrids and competitive hybrids that a lot of you currently grow. Each plot is 8 rows wide by 56 feet long and there are replicated check hybrids at each location. The check hybrids are proven Pioneer hybrids currently sold. The IMPACT plot is the last step in the selection process new hybrids are subjected to. The new hybrid, or soybean variety, must do well in IMPACT testing before they make the team.
IMPACT plot locations are carefully chosen and placed on a wide range of soil types from sand to loam to heavy clay. The intent is to expose hybrids to typical field conditions that occur across Ontario. The main criteria of each site is uniformity of soil type, drainage and slope. Those of you that know the front of Bill's farm understand why this location meets the standard. It would be considered a high yield site with well drained silt loam soil.
The only problem is when you receive one inch of rain from July through August a site with high yield potential can become somewhat less than high yield. And pose a challenging question to the evaluation team.


The correct answer is, while the mental pictures will stay in our head, the yield data generated from this one location is probably useless. There is too much variability to generate meaningful comparisons.
This makes us ponder the strip plot comparisons we have planted in our own fields. Will this information be useful? Or do we have the same problem as this IMPACT site?
Sunday, September 16, 2012
John Deere Beans
Drought stress causes responses in soybeans that are quite striking. With all due respect to a certain much revered farm equipment manufacturer, the colour green in soybeans at harvest time is not a good thing.
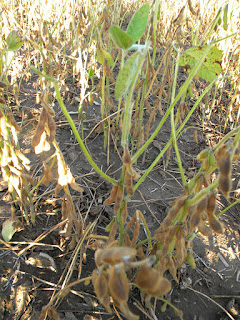 Soybean harvest is underway and we are hearing about green stems, leaves and what some folks are calling secondary growth or re-growth. A corn plant tends to die when subjected to drought stress during the growing season, but a soybean plant does the opposite. There is a genetic component to the symptom because certain varieties will hang onto the green colour more than others, but the condition is always worse in the drought effected pockets in the field. The heat and drought stress caused the soybean plant to abort flower production and set fewer pods. The reason the plant stays green is because there are not enough beans hanging on the plant to drain the carbohydrate reserves from the stems and leaves. The draw of the beans on these reserves is part of the maturation process which cause the plant to die. With fewer beans to feed, the plant's death spiral takes longer than it should. If there are green leaves still hanging on it indicates the plant could have fed a lot more beans. It is not a re-growth symptom like we sometimes see in edible beans. The soybean plant will not take a late season growth spurt and try to make more beans because its day length mechanism is telling it to shut down.
And remember those potash deficient soybeans that I had shown in a previous post.
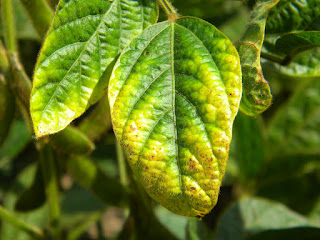 This is what they look like now.
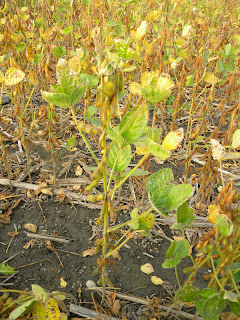 A lot of green stems and leaves because the problem is the same. Poor pod set and few beans. Any stress that interferes with pod set can create more "John Deere beans".
Green seed can also be a problem in the stressed areas, especially for IP soybean contracts. The green seed will be very slow to dry, but if you have a bin and can store them for a few months the green beans will dry down. It just takes time.
And speaking of time, with harvest occurring earlier this year there is a perfect opportunity to spray soybean stubble ahead of or just after wheat planting. Even my buddy Peter Johnson will agree that the perfect time for weed control in your wheat crop is at planting time. Spring herbicide application is too often just revenge spraying. The damage usually has been done before we realize weeds are present or it rains too much, keeping the sprayer out of the field. A fall spray of your favourite glyphosate product will almost guarantee you don't have to spray in the spring.

And remember those potash deficient soybeans that I had shown in a previous post.


Green seed can also be a problem in the stressed areas, especially for IP soybean contracts. The green seed will be very slow to dry, but if you have a bin and can store them for a few months the green beans will dry down. It just takes time.
And speaking of time, with harvest occurring earlier this year there is a perfect opportunity to spray soybean stubble ahead of or just after wheat planting. Even my buddy Peter Johnson will agree that the perfect time for weed control in your wheat crop is at planting time. Spring herbicide application is too often just revenge spraying. The damage usually has been done before we realize weeds are present or it rains too much, keeping the sprayer out of the field. A fall spray of your favourite glyphosate product will almost guarantee you don't have to spray in the spring.
Sunday, September 9, 2012
Hayden's New Defence Partner
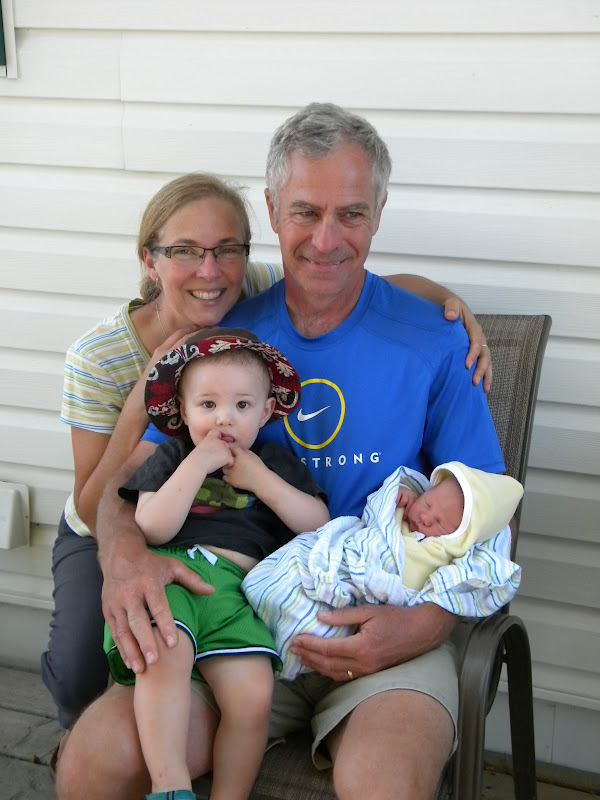
I have been remiss in not highlighting the newest member of the Barker family. On August 29 around 10:00 pm Brian called to let us know that Hayden had a new baby brother, Liam.
 April, delivered Liam at home with the assistance of a mid-wife and all went very well. Liam arrived in the world weighing 7lb 2 oz. We are very proud of our our daughter in law and her decision to do it the "old fashioned way".
Grandma Barker now has two perfect little boys to brag about. She embraces this task with enthusiasm because she has never been able to brag about the two less than perfect older Barker boys.
Grandma Barker now has two perfect little boys to brag about. She embraces this task with enthusiasm because she has never been able to brag about the two less than perfect older Barker boys.
Tuesday, September 4, 2012
Another Tool For Silage Producers
.JPG)
Corn silage harvest is at full throttle. Usually there is a lot more discussion on whether the corn crop is ready to ensile. Given that all fields appear to be rapidly drying in the heat, the issue this year is the availability of harvesters and manpower. There is a lack of both on some days.
Pioneer has been working on a computer model to predict silage maturity. It is based on hybrid selection, planting date, soil type and localized weather data that when compiled together will give the silage producer another tool to help manage corn silage harvest. It will be provided as a service to growers who plant Pioneer corn silage.
This year a number of growers have been enrolled in a pilot program to field test the validity of the software. Maybe not the ideal year for a pilot program like this, but the system has been in development for a few years and every year is a learning experience.
When enrolled you get access to a website that will predict the DM and daily growing degree accumulation.

This is what the display looks like. It will give you to judge how quickly your silage is advancing to the proper DM content for your operation.
Subscribe to:
Posts (Atom)